Why the German power market matters in global energy trading
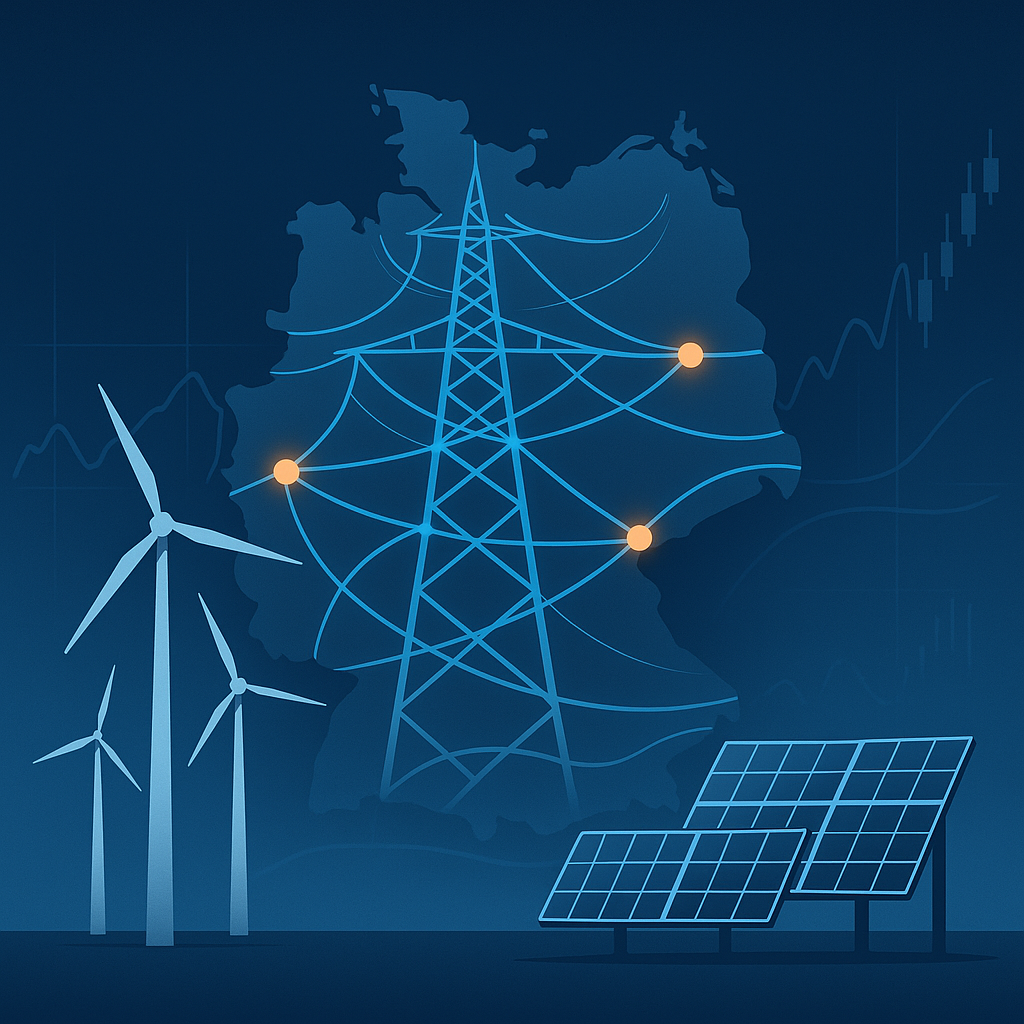
Germany runs Europe’s largest and most liquid electricity market. It’s the hub from where energy prices, policy shifts, and volatility patterns ripple across the continent. For systematic and technical traders, understanding the German power curve is essential.
Adjacent European power markets including the nordics, western Europe and central Europe tend to move in tandem with the German power prices. Traders and hedgers operating in those energy hubs keep a close eye on German power prices to time trades on their less liquid markets.
Market structure and key traded products
The German transmission system is managed by the four transmission system operators (TSOs) Amprion GmbH, TenneT TSO GmbH, 50Hertz Transmission GmbH and TransnetBW GmbH. The wholesale market connects over 800 regional grid operators under these four TSOs.
Electricity is traded mainly through the European Energy Exchange (EEX) in Leipzig, which lists day-ahead, intraday, and futures contracts covering baseload and peakload delivery periods from hours to years ahead.
The most liquid products are the front-year, followed by the quarters. With the rise of systematic and algorithmic trading, even the previously less liquid front-month product has seen a rise in trading activity over the past years.
Prices form through continuous auctions, with cross-border capacity linked to France, the Netherlands, Denmark, and Poland.
Spot and futures data together form the core of most algorithmic trading strategies and technical analysis services in Europe.
Price drivers and volatility factors
German power prices are shaped by renewables output, fuel markets, and cross-border flows.
Wind and solar now account for over half of generation, making forecast error in renewable output the single biggest short-term driver of volatility. When wind underperforms, gas and coal plants set the marginal price. This links electricity directly to TTF gas and Brent crude oil trends.
Carbon costs add another layer. Changes in EUA carbon price forecasts alter generation margins and influence the futures curve on EEX.
Volatility also arises from grid congestion between northern generation zones and southern demand, often creating price spreads across delivery areas and intraday arbitrage opportunities.
Seasonal shifts, fuel inventory data, and policy events complete the supply and demand picture.
These factors help assess the rough direction of the price. However, having a directional preference is a good starting point, but not enough to generate a trading edge. On top of these fundamental models, an additional technical analysis layer provides actionability. Technical analysis formalises best trading practices for confirming trends, planning trades and managing risk.
German power spread trading
Speculative desks and institutional traders use the same EEX futures curve to take both outright directional and spread positions.
A spread trade means buying one contract and selling another to capture price differentials rather than outright moves.
For example:
- Germany–France spread: traders go long German power and short French power to express a view on regional generation margins or weather-driven imbalances. When French nuclear output drops or German wind surges, the spread can widen sharply. This spread between hubs is called location spread.
- Calendar spread: involves buying one delivery period (e.g. Q2-25) and selling another (e.g. Q3-25) to trade seasonal fundamentals like summer demand or maintenance outages. This spread between delivery periods is called time spread.
- Baseload–peakload switch: compares flat 24-hour delivery versus daytime peak hours. It reflects how solar generation depresses midday prices and is widely used in electricity hedging.
These spreads create structured, lower-volatility trades for funds and systematic traders. Instead of betting on outright direction, they profit from relative shifts, which is ideal for algorithmic trading models that thrive on mean reversion and statistical convergence.
What are clean dark spreads and clean spark spreads in German power trading?
Clean dark and clean spark spreads show how profitable coal and gas power plants are after paying for fuel and carbon emissions. The clean dark spread measures the margin for coal; the clean spark spread does the same for gas.
For example, when the spark spread rises, gas plants are cheaper to run than coal, so gas often becomes the marginal price setter in the German power market.
These spreads are essential for hedging strategies because they help producers lock in generation margins and guide which fuel to hedge. For algorithmic trading, they act as early signals of price rotation. When spreads shift, the direction of the power market often follows. Monitoring these spreads helps traders anticipate regime changes instead of reacting to them.
Technical Analysis for German Power Trading
German power prices often oscillate between long periods of compression and short bursts of directional momentum. These are ideal conditions for technical analysis.
On the daily chart, extended sideways ranges form when renewables output is stable and gas prices flatline. This has been the case for most of 2025 for the most liquid front-year product. During such periods, traders are generally advised to zoom in on the intra-day timeframes to optimise trade planning. Oscillators and candle patterns may help to anticipate smaller turning points within the trading range.
Volatility spikes follow when wind forecasts collapse or carbon costs surge, creating clean breakout structures that trend traders can exploit. Momentum tools like ADX and MACD help identify when energy prices are transitioning from balance to imbalance. This is when traders are advised to switch from a mean-reversion strategy to a trend-following strategy.
Building a methodology
For German power markets, understanding technical analysis isn’t optional. It has become the default mode for most energy desks. Risk and compliance teams are also pushing for a standardised set of best trading practices.
At Clever Markets, we help speculative and physical trading teams with embedding best systematic trading practices into the daily workflow.
We coach teams in our Technical Analysis Academy and embed systematic trading methodologies into your daily workflow with our Energy TA Hub. Talk to our analysts to get started.
Frequently Asked Questions (FAQs)
1. What makes the German electricity market important in global energy trading?
Germany operates Europe’s largest and most liquid electricity market. Its influence extends across the continent, with neighbouring markets such as France, the Nordics, and Central Europe often following German price trends. This makes German power pricing a critical benchmark for energy traders and policy analysts alike.
2. How is electricity traded in the German power market?
Electricity in Germany is mainly traded on the European Energy Exchange (EEX) in Leipzig. Products range from spot (day-ahead and intraday) to futures contracts, covering delivery periods from hours to multiple years ahead. The most liquid contracts include front-year and quarterly futures, which are popular with institutional and algorithmic traders.
3. What factors influence German power prices?
German power prices are shaped by multiple dynamic factors, including renewable energy output (especially wind and solar), gas and coal markets, carbon emissions costs, and cross-border power flows. Short-term volatility is often driven by errors in weather forecasts, while longer-term price movements reflect shifts in fuel costs, regulatory policy, and carbon pricing.
4. What are common spread trading strategies in the German power market?
Traders often use spread trading to profit from price differentials rather than outright market direction. Common spreads include:
- Location spread (e.g. Germany–France) based on regional supply/demand imbalances.
- Calendar spread (e.g. Q2 vs Q3) to trade seasonal trends.
- Baseload–peakload spread to capture solar-driven price fluctuations.
These structured trades tend to carry lower volatility, making them ideal for systematic and hedging strategies.
5. How does technical analysis support trading in German power futures?
Technical analysis is essential for navigating the volatility of German power prices. During stable periods, traders use oscillators and candle patterns on shorter timeframes to capture intraday movements. In contrast, during breakout phases driven by wind forecast collapses or carbon price shocks, momentum indicators like MACD and ADX help identify trend reversals. Most energy desks now rely on technical analysis as a core part of their trading methodology.