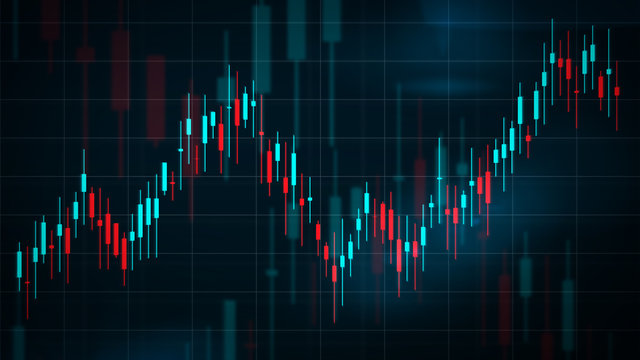
Introduction to candlesticks
Candlestick patterns are one of the most insightful ‘sentiment tools’ available to institutional energy traders. That’s because they show us what the market is thinking about the current supply and demand balance.
Candle patterns are an important tool to determine market psychology and sentiment. They also help to identify potential turning points and trade setups.
They do this by categorising common open, high, low and close (OHLC) constellations. It is highly recommended to memorise the patterns and understand their psychological meaning.
But caution is advised, candlestick patterns are generally less reliable in the energy markets than is typically assumed. We show you how you can still take advantage of them.
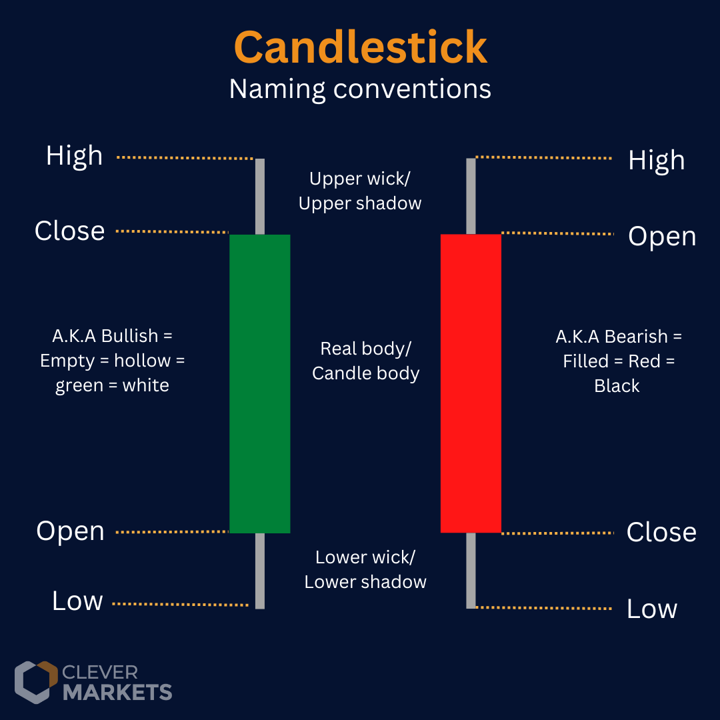
Anatomy of a candlestick
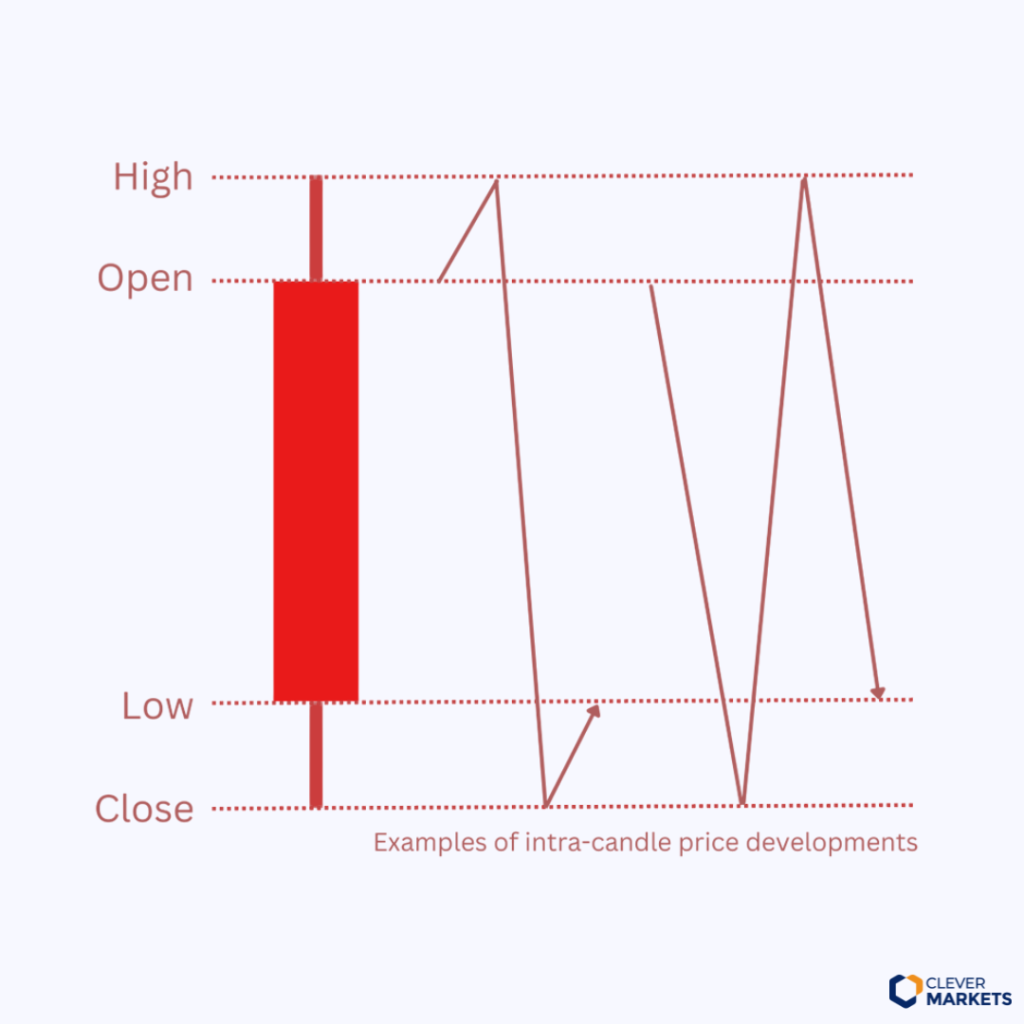
Candlesticks are fractal. That means you only have to learn the anatomy of different patterns once. You can then apply that knowledge to all markets and timeframes, from 1-minute to monthly charts.
A candlestick is constructed as shown in the graph below.
Trading with candlesticks in a range market
In a sideways market, traders are generally advised to switch to a mean-reverting strategy. This means trading the smaller swings within the range on the lower-level timeframes. Volume, oscillators, candle patterns and key levels are the most important tools that need to be mastered to profit from smaller swings in a predictable range.
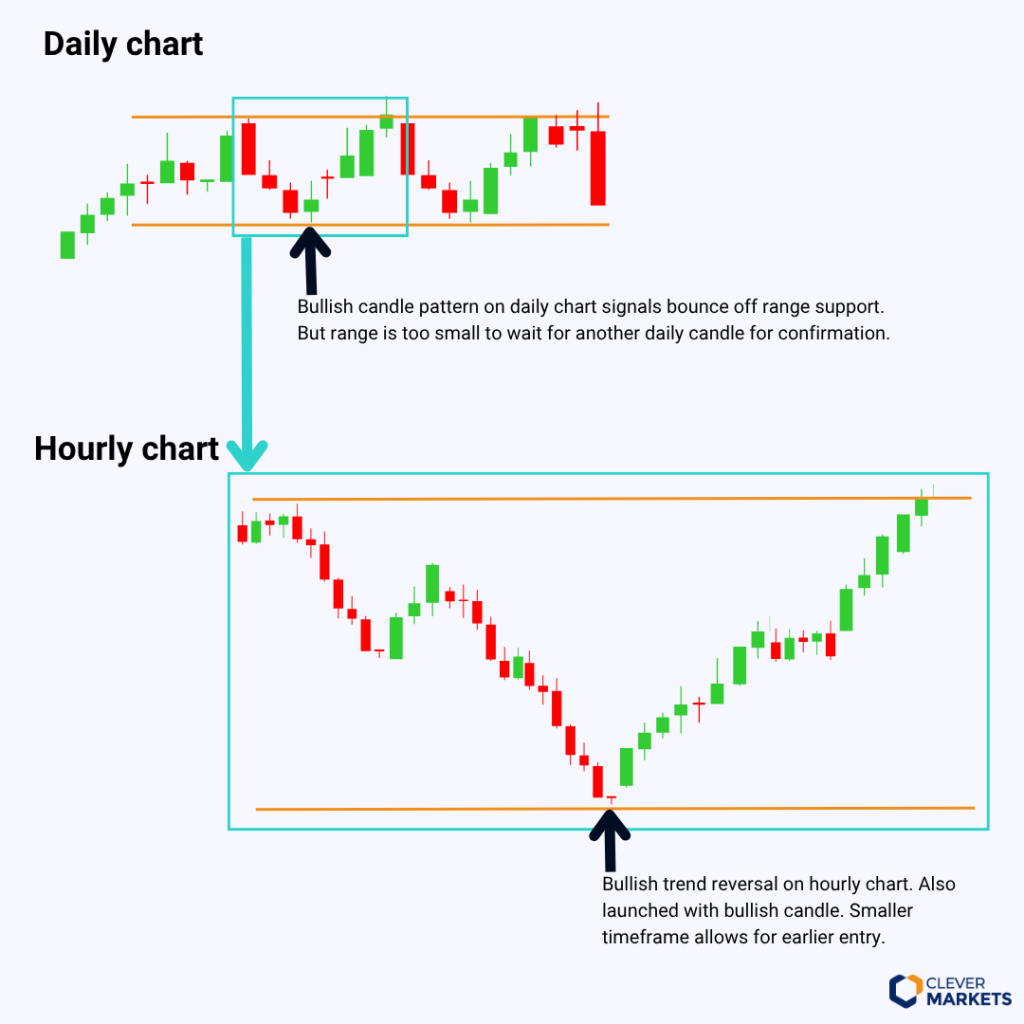
If a reversal candle pattern is spotted at the range’s border, the short-term market may reverse and continue the range with another swing sideways.
In tight price ranges, the uplegs and downlegs may be too short to trade on the daily chart. So even if a reversal candle pattern is spotted on the daily chart, the trend may be too short to profit from it.
In such a scenario, it often makes sense for an energy trader to move into the intra-day chart to trade the reversal candle setup effectively.
In short: once you spot a reversal candle on the daily chart in a range market, move on to the hourly chart to actually plan your entry and exit.
Trading a breakout with candlesticks
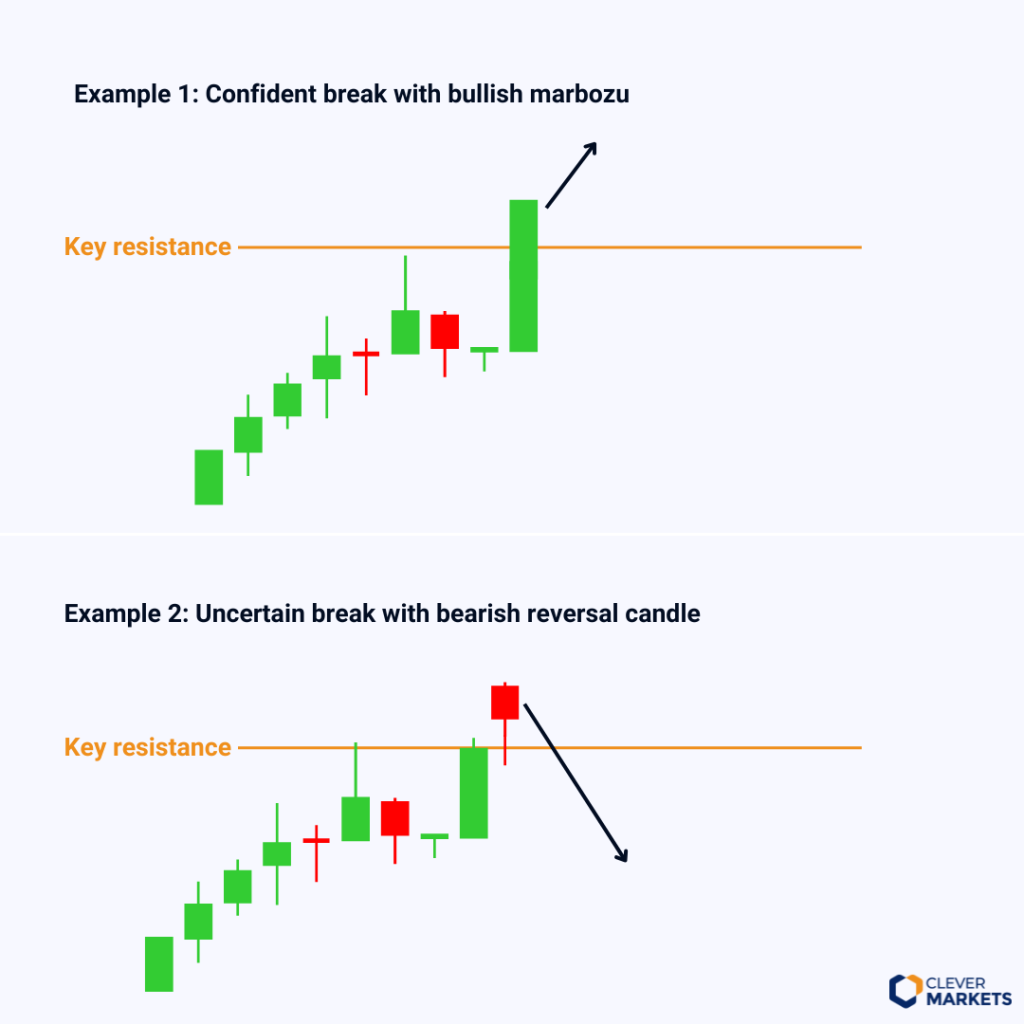
If a range market or a key level is surpassed, understand on what candle the level broke. This will help determine if the move was convincing or a fakeout.
For example, if a key level breaks with a high-volume marubozu, then the move is more likely to be sustained. If, however, the market breaks higher with a bearish candle, caution is advised because it increases chances of the move having been a fakeout.
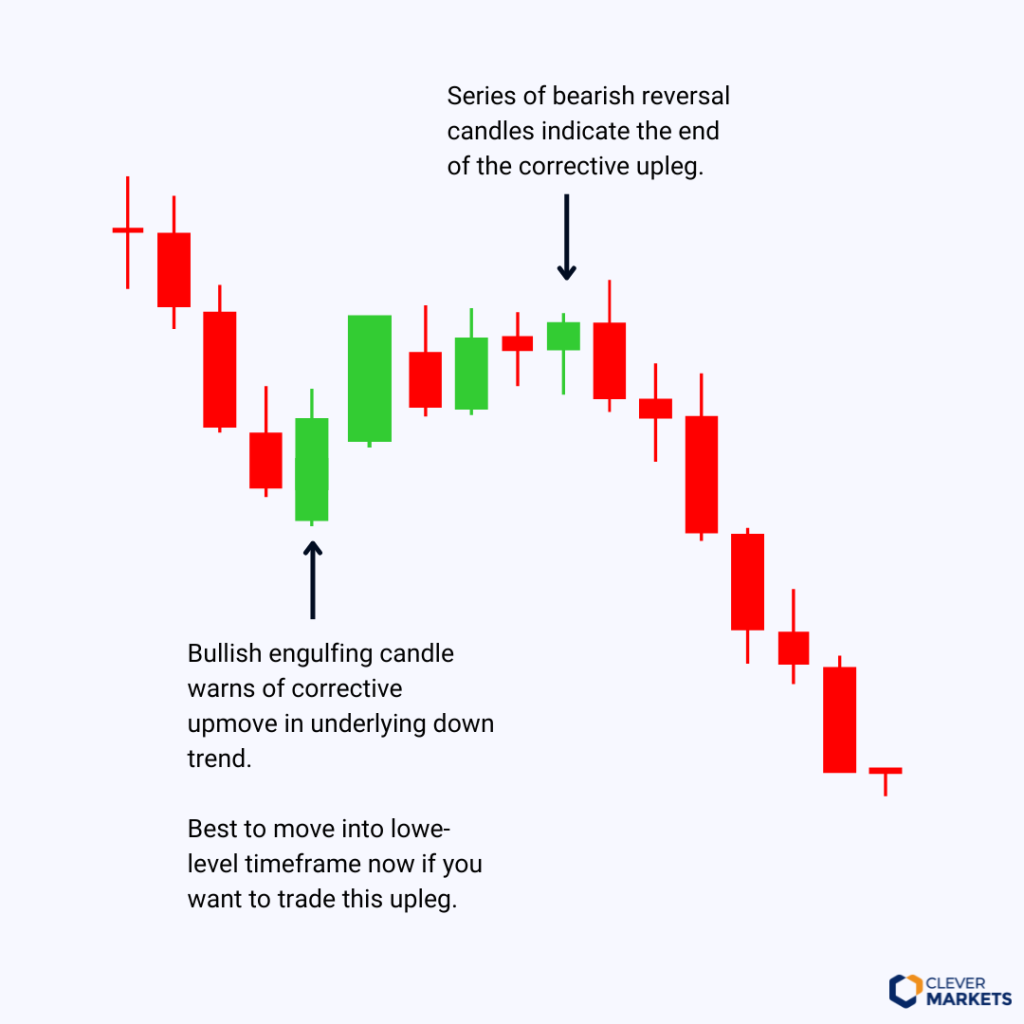
Momentum trading with candlesticks
Once a strong trend is underway, traders may decide to put on swing trades in line with the market’s main direction. Candles help to anticipate the smaller reversals. For example, in an uptrend that is defined by a rising channel, bullish reversal candles at the channel support will signal a bounce to continue the uptrend. A bearish reversal candle at the channel resistance warns of a corrective downmove.
Once again, once the reversal candle patterns are spotted on the daily chart, traders are advised to fine-tune the actual trading decision on the lower-level chart.
Limitations of candlestick patterns
Candle patterns don’t work reliably in isolation and often don’t mean anything without a preceding trend. In the energy markets, most candle patterns’ reliability is so bad, they work better as a contrarian signal.The reliability of most candle patterns barely improves to a coin toss even with validity filters.
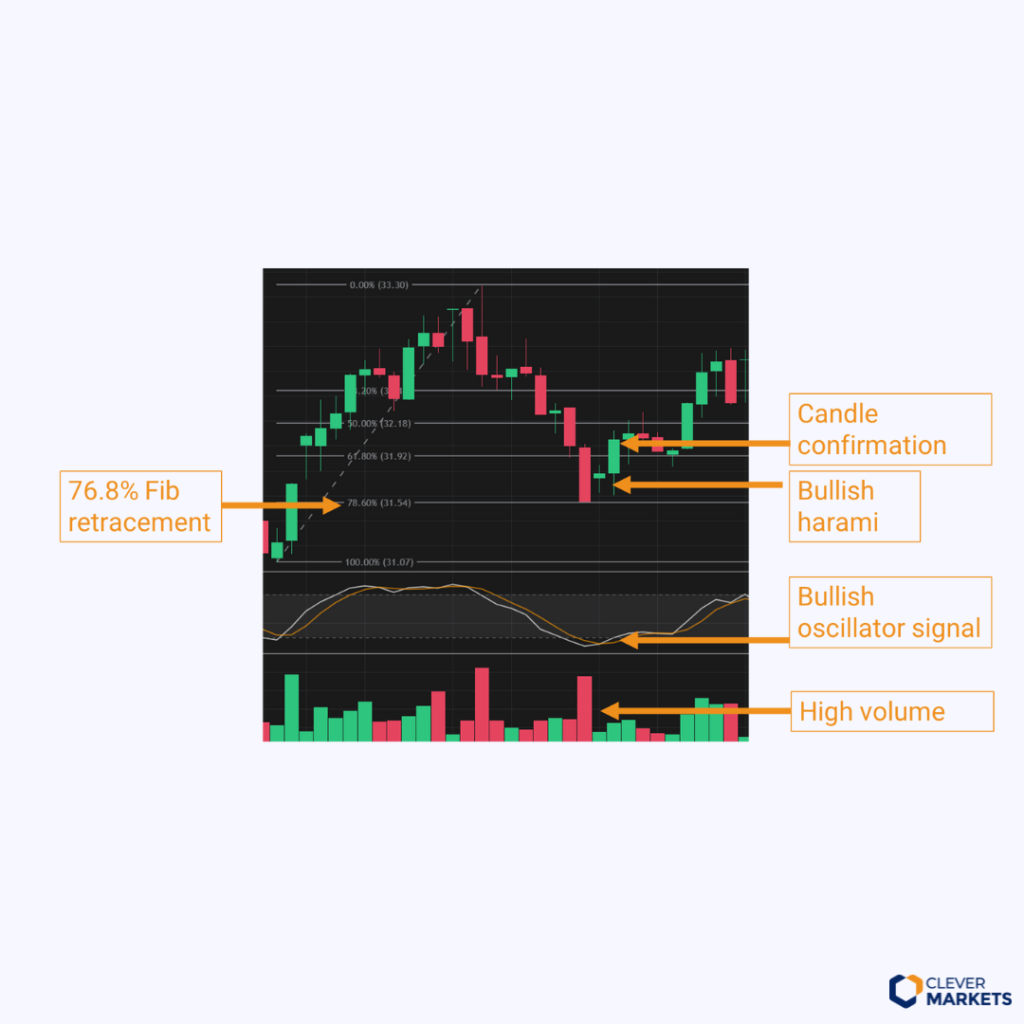
But they still play an important role in highlighting potential turning points. We can take advantage of that.
Confirmation is always needed to increase the reliability of candlestick patterns. Chances of a pattern working out are higher if confirmed by volume, oscillators, and adjacent key levels.
Our rigorous backtesting analysis shows the detailed breakdown of candlestick success rate, both with and without confirmation. This breakdown is available to Clever Markets clients.
Candle gives only a rough idea of the price trajectory within the candle timeframe because it only pinpoints the OHLC, not what happens in-between those points. True price trajectory only visible on lower-level timeframes.
Universal Guidelines
Candle pattern completion
One-, two- and three-candle patterns exist. The more candles the formation consists of, the more convincing it is.
One- and two-candle patterns require an additional candle for confirmation. Confirmation is given once the next candle closes past the validation level of the pattern. A wick penetration is not enough.
In line with the Clever Markets methodology, the confirmation must come within two candles after the pattern is shaped up. This can mean two hourly candles or two daily candles, depending on the timeframe.
Three-candle patterns do not require additional confirmation and can usually be entered at the start of the fourth candle.
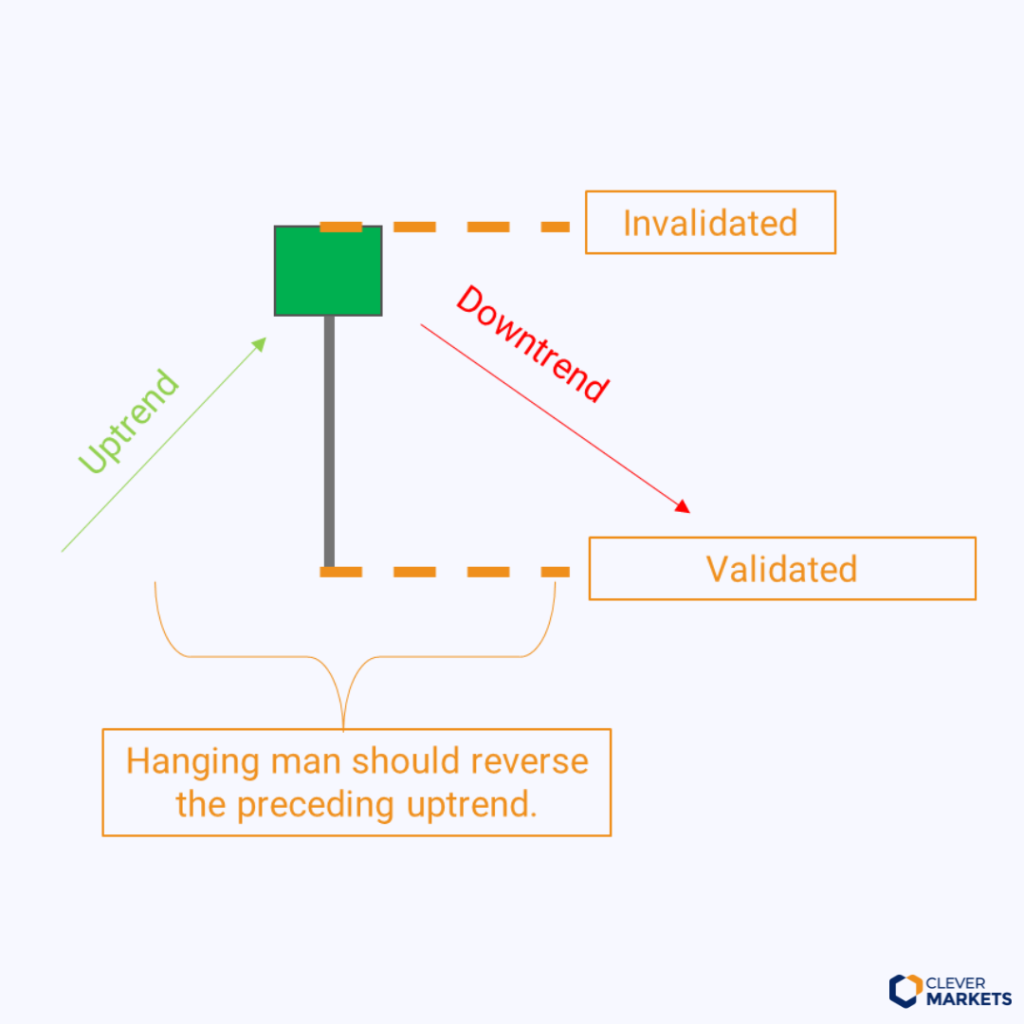
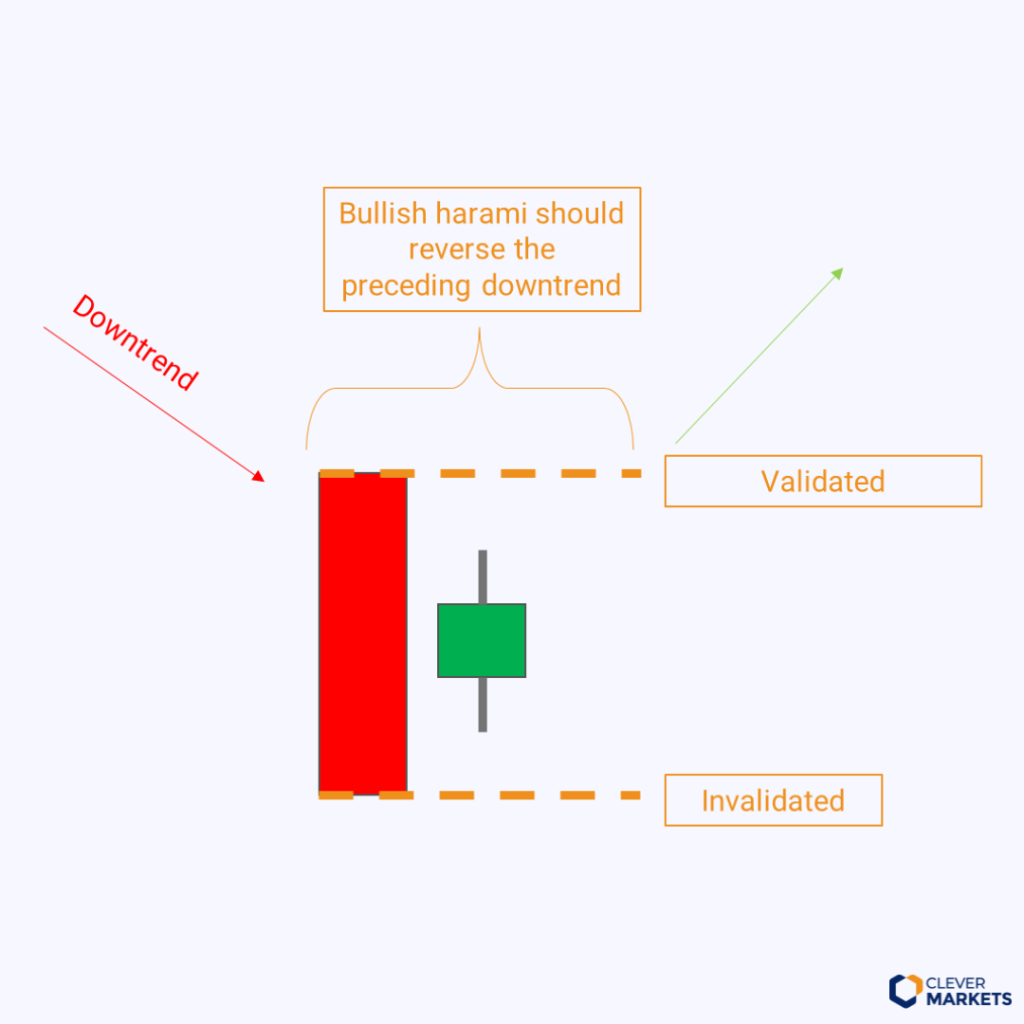
The pattern setup is invalidated with a candle close past the pattern invalidation level. Wick penetration does not count.
Increasing the likelihood of a candle pattern working out
To increase the likelihood of a candlestick pattern working out, traders are advised to wait for some or most of the following confirming signals:
- Price confirmation: Wait for one additional candle close past the pattern before entering, as discussed previously.
- Volume: High volume increases chances of the pattern working out because it shows that the market is going through a serious price-finding process.
- Key levels: If the pattern shapes up near an important key level, chances of a reversal increase because many traders will have placed stops in that area.
- Oscillator confirmation: wait for a confirming signal from an oscillator. In energy markets, slow stochastic is the preferred choice for Clever Markets.
Importance of the preceding trend
The same shaped candle pattern can often appear at the top or bottom of a trend. In order to identify the candle pattern correctly, the preceding trend must be taken into account.
For example, at the bottom of a trend we might identify a hammer candle that usually leads to a price increase. At the top of a trend, the same shaped candle would be identified as a hanging man and would usually result in a price decline. So be mindful of the preceding trend.

If no clear preceding trend is visible and the market is pushing sideways, candles often have no predictive quality at all.
Candle wicks and body size
- Larger bodies and small wicks suggest increasing confidence and momentum in the direction of the trend.
- Long wicks and small bodies imply growing hesitation, often signalling a nearby key level or potential reversal.
- The longer the wick, the more significant the level being tested or rejected.
We often observe that candle bodies grow longer as a confident trend emerges. Once an important levels approached or momentum declines, candle bodies tend to get smaller and wicks tend to get longer.

Pattern library
We have backtested the most common candle patterns in the hourly, daily and weekly timeframes for the most liquid energy markets.
The markets under observation were:
- TTF front month and front season,
- NBP front month and front season,
- EUAs front December,
- German Power front year,
- Brent,
- Henry Hub.
To identify a candle pattern accurately, we ensured that the preceding trend is correct.
For each candle pattern we provide performance results for both, the confirmed and unconfirmed scenarios.
Confirmation can sometimes increase the reliability of the candle pattern. But in some rare cases, it worsens it. Confirmed patterns are those that have one additional candle close past the pattern as well as a supporting signal from the slow stochastic indicator.
Unconfirmed candle patterns are those that have the correct preceding trend and nothing else.
The full backtested library of candlestick patterns for the European energy markets is available for Clever Markets clients only.