European Energy Markets:
The bulls continue – range resolution required
Here’s my promise to you today. I will not speculate what the next phase of the US / Iran war will look like. I will not anticipate the next bit of news.
There are simply too many moving parts and the price-finding process is still ongoing. Some traders think this might blow over, others are pricing in world war 3. This makes it near impossible to build an edge from fundamentals only.
Instead of finding the ultimate truth, we will simply focus on price action. Because even if a move is not supported by fundamental, we can still profit from it if we rely on systematic trading.
Let’s start with Brent. Our proprietary indicators show that an ‘extreme trend’ reading has been reached. This is the eighths time we get such a rare signal over the past decade. Five out of the preceding seven signals led to a steep price decline. However, the situation is now playing out just like the crisis surge seen in the Russia-Ukraine war which could fuel further continuation instead. A break above the prior peak resistance at $97.69/bbl would likely target the psychologically important resistance at $100/bbl.
TTF, NBP, Henry Hub and German power are all ready to move higher still early this week. For the TTF and NBP, prerequisite is a push above their respective congestion areas.
EUAs are still aught in their sideways range, that is expected to resolve lower eventually.
Get the full weekly analysis with actionable TTF insights directly to your inbox for free. Click here.
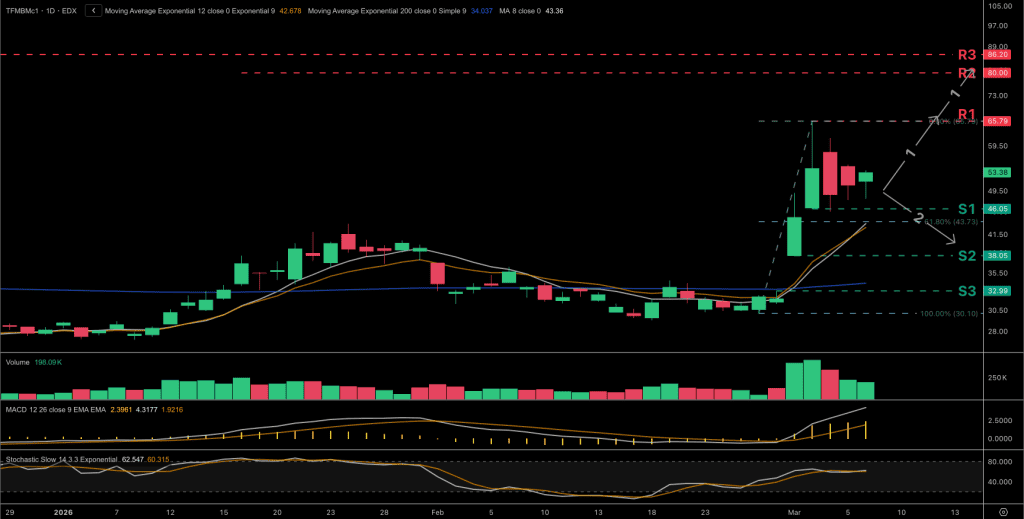
TTF Front Month gas outlook
- If the 61.8% Fib target near €46.05/MWh (S1) holds, bulls may reassert control to resume the uptrend toward the €65.79/MWh (R1) where the dark cloud cover may be invalidated.
- A rise above €65.79/MWh (R1) would invalidate the candle pattern and weaken bearish confidence and could lead to a test of the psychological resistance at €80/MWh (R2).
- Tools indicate growing bullish momentum while our algos suggest a bull trend growing under a trending regime, pointing to an increasing likelihood of upside continuation.
- An ascending triangle formation developing on the hourly chart could provide bullish traders with better timing if breached.
This is the shortened free version available to newsletter subscribers. Contact us to get access to the full dashboard that includes alternative scenarios, multiple timeframes, trigger levels, quant signals, pattern backtests and much more.
Watch the full weekly analysis video here.
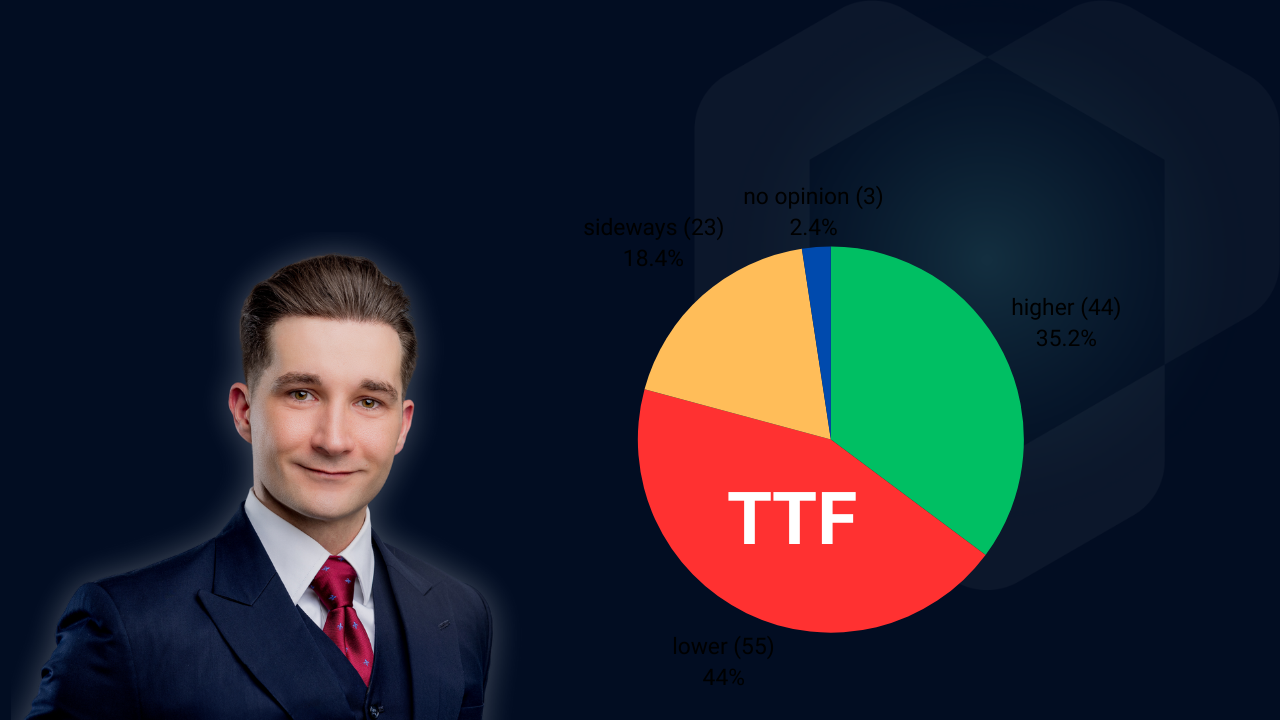
TTF Sentiment Benchmark
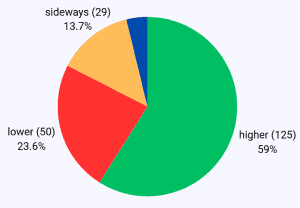
The bulls are dominating the sentiment with nearly 60%. This continues high upside confidence for a second consecutive week. With the daily chart having formed a congestion area, this suggests that eventual upside is most likely to continue.
Want access to the benchmark history? Contact us to get started with Clever Markets.